Glossary
Glossary
Terminology

Building blocks are the economic sectors, such as energy, transport or industry, and cross-cutting areas, such as finance, innovation, and lifestyles, in which transformation is needed to achieve a climate neutral society by 2050, and across which ECNO tracks progress.
Building block assessment
Acceleration factor
Or the ‘required change in speed’ is the ratio of the required change versus the past change on a given indicator. This results in the example formulation: ‘We need to increase our annual emission reductions to at least 4.9 Mt CO2e per year – or 2.6 times faster than the 1.9 MtCO2e per year achieved in the past’.
Benchmarks
Future reference points against which progress for each indicator is compared. ECNO derives benchmarks from official EU sources, such as directives, regulations, strategies, and action plans, including their related impact assessments. Benchmarks often come in the form of quantified policy goals or targets.
Climate neutrality
Stands for the objective of achieving net zero greenhouse gas (GHG) emissions. This means that emissions are brought down as close to zero as possible, with remaining, difficult to abate emissions balanced by GHG removals within a given country or region.
Enablers
The supporting conditions and underlying changes needed to meet the objectives in a given building block. They are the opposite of barriers or inhibitors.
Historical data
Includes, but is not limited to, statistics from Member States harmonised and provided by Eurostat or the European Environment Agency (EEA) as well as from international organisations such as the OECD, FAO, or World Bank.
Indicators
Track the historical development and status of enablers and objectives based on quantitative data. An assessment of indicator progress compares the trend against the required development to meet a future reference point, where data and relevant benchmarks are available.
Objectives
Describe what needs to be achieved in each building block to reach climate neutrality.
Required change
The change that underlies a pathway that meets the identified benchmark or target. Where benchmarks are missing, the required change indicates a direction and speed of change.
Trend
The development of an indicator over time based on historical data. ECNO’s trendline is a straight, best-fit line that smooths out the variation in historical developments based on all data points, providing a sense of the general progress over time.
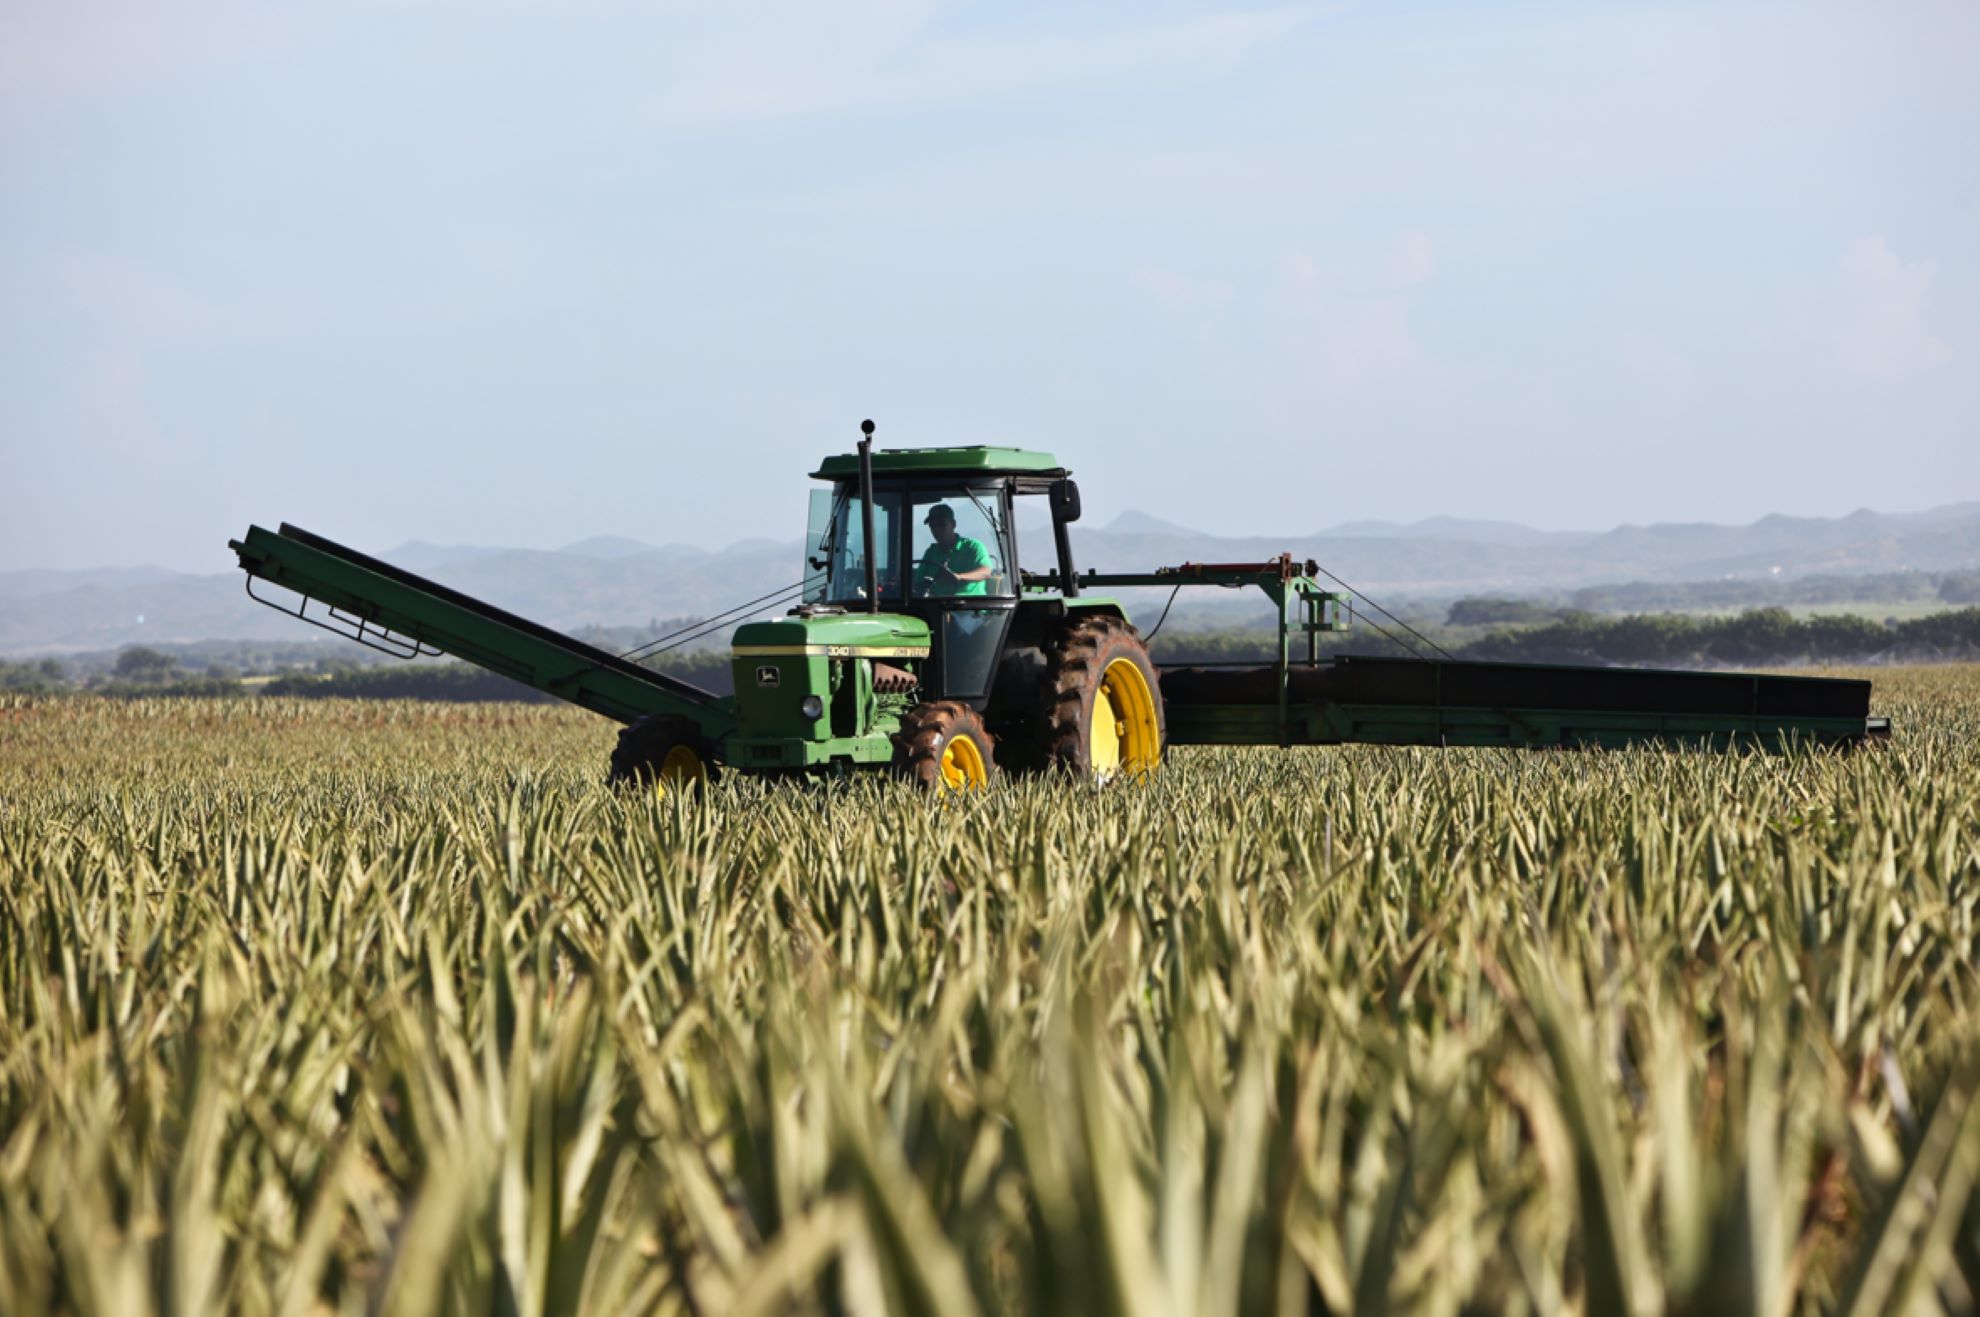

Agrifood
Agrifood refers to all stages of the agricultural supply chain, from food production to consumption to disposal, while also considering aspects of land use and the production of agricultural inputs.
OVERVIEW:
Progress on agrifood has been far too slow
Emissions have decreased; however, progress among key enablers, including diet shifts, manure management, and food waste, remains far too slow to unlock the next level of reductions.
Progress towards climate neutrality was far too slow in the EU’s agrifood sector in the assessed period. The outlook for overall GHG emissions reduction slightly improved since last year’ assessment, but reductions were still not occurring fast enough; in particular, reductions in downstream sectoral emissions need acceleration. Cattle meat consumption levels remained too high. The EU will likely fall short of its 2030 targets for nitrogen fertiliser use, organic farming expansion, and food waste reduction. The manure management emissions intensity of cattle and total livestock numbers were both headed in the wrong direction.
Since 2020, the EU’s guiding framework for mitigating emissions from the agrifood system is the Farm to Fork Strategy (F2F). The F2F Strategy outlines a set of largely voluntary measures that leverage the link between human health and environmental sustainability. Revised in 2021, the Common Agricultural Policy (CAP) is the EU’s principal financing mechanism for the agricultural sector. The revision claims to channel 40% of its budget towards providing ‘climate-relevant’ support (EC, 2021n), but a serious reduction in emissions is unlikely; especially given that, following union-wide protests from farmers, the EC proposed loosening key environmental regulations under the CAP and removed the mention of a 25% reduction target for non-CO2 emissions from the agrifood sector from its 2040 target update.
The EU’s vision for the agrifood sector, as laid out in the F2F Strategy, has not been supported by sufficient, compulsory policy: many of the proposed policy actions—notably, the legislative framework for sustainable food systems—have not materialised. The CAP’s funding structure could encourage a sustainable, increasingly plant-based food system instead of incentivising emissions-intensive, animalbased agriculture. As the recent protests from European farmers highlight, this shift will require careful planning and integration within a long-term, just transition strategy. Critically, supply-side measures should be complemented by policies on demand. The EU could also clarify inconsistencies in its signals regarding food waste reduction targets.
INSIGHT TWO
The EU's Farm to Fork Strategy lays out policy actions that can leverage the shift to more sustainable diets.
However, most of the proposed measures have not been implemented. The EU lacks a detailed plan for the agricultural sector.
INSIGHT THREE
The revised CAP is delaying progress.
The EU’s main subsidy scheme for the agrifood sector continues to incentivise emissions-intensive, industrialised agriculture, and, in doing so, hinders a socially just transition for EU farmers.
OBJECTIVES
Objectives describe what needs to be achieved in each building block to reach climate neutrality.
Objective
Minimising agrifood emissions and shifting diets
Reductions in agrifood emissions, which include onfarm emissions, but exclude energy use and LULUCF emissions, were too slow to reach the EU’s 2050 emission target level of 245 MtCO2e. Compared to last year’s progress assessment, the rate of emissions reduction increased but still needs to be further accelerated. The decrease in emissions may be attributed to decreased fertiliser use caused by the energy crisis. The status of shifting towards less emissions-intensive diets remained too slow and was incompatible with the EU’s target of decreasing cattle meat consumption by 34% in 2050 compared to 2013 consumption levels.
Agricultural emissions
This indicator shows past development in EU agricultural GHG emissions in comparison to the EU target of reaching agricultural emissions levels of 254 MtCO2e in 2050 (middle value of 1.5TECH and 1.5 LIFE scenarios outlined in the EU LTS). The data show an annual decrease of 3.0 MtCO2e between 2017 and 2022. To meet the target, the required annual reduction between 2022 and 2050 needs to be 4.2 MtCO2e, which is 1.4 times faster than the current rate of progress.
Agricultural emissions pertain to on-farm emissions from agricultural production, excluding energy use and LULUCF, and include the same sources as defined by the UNFCCC.
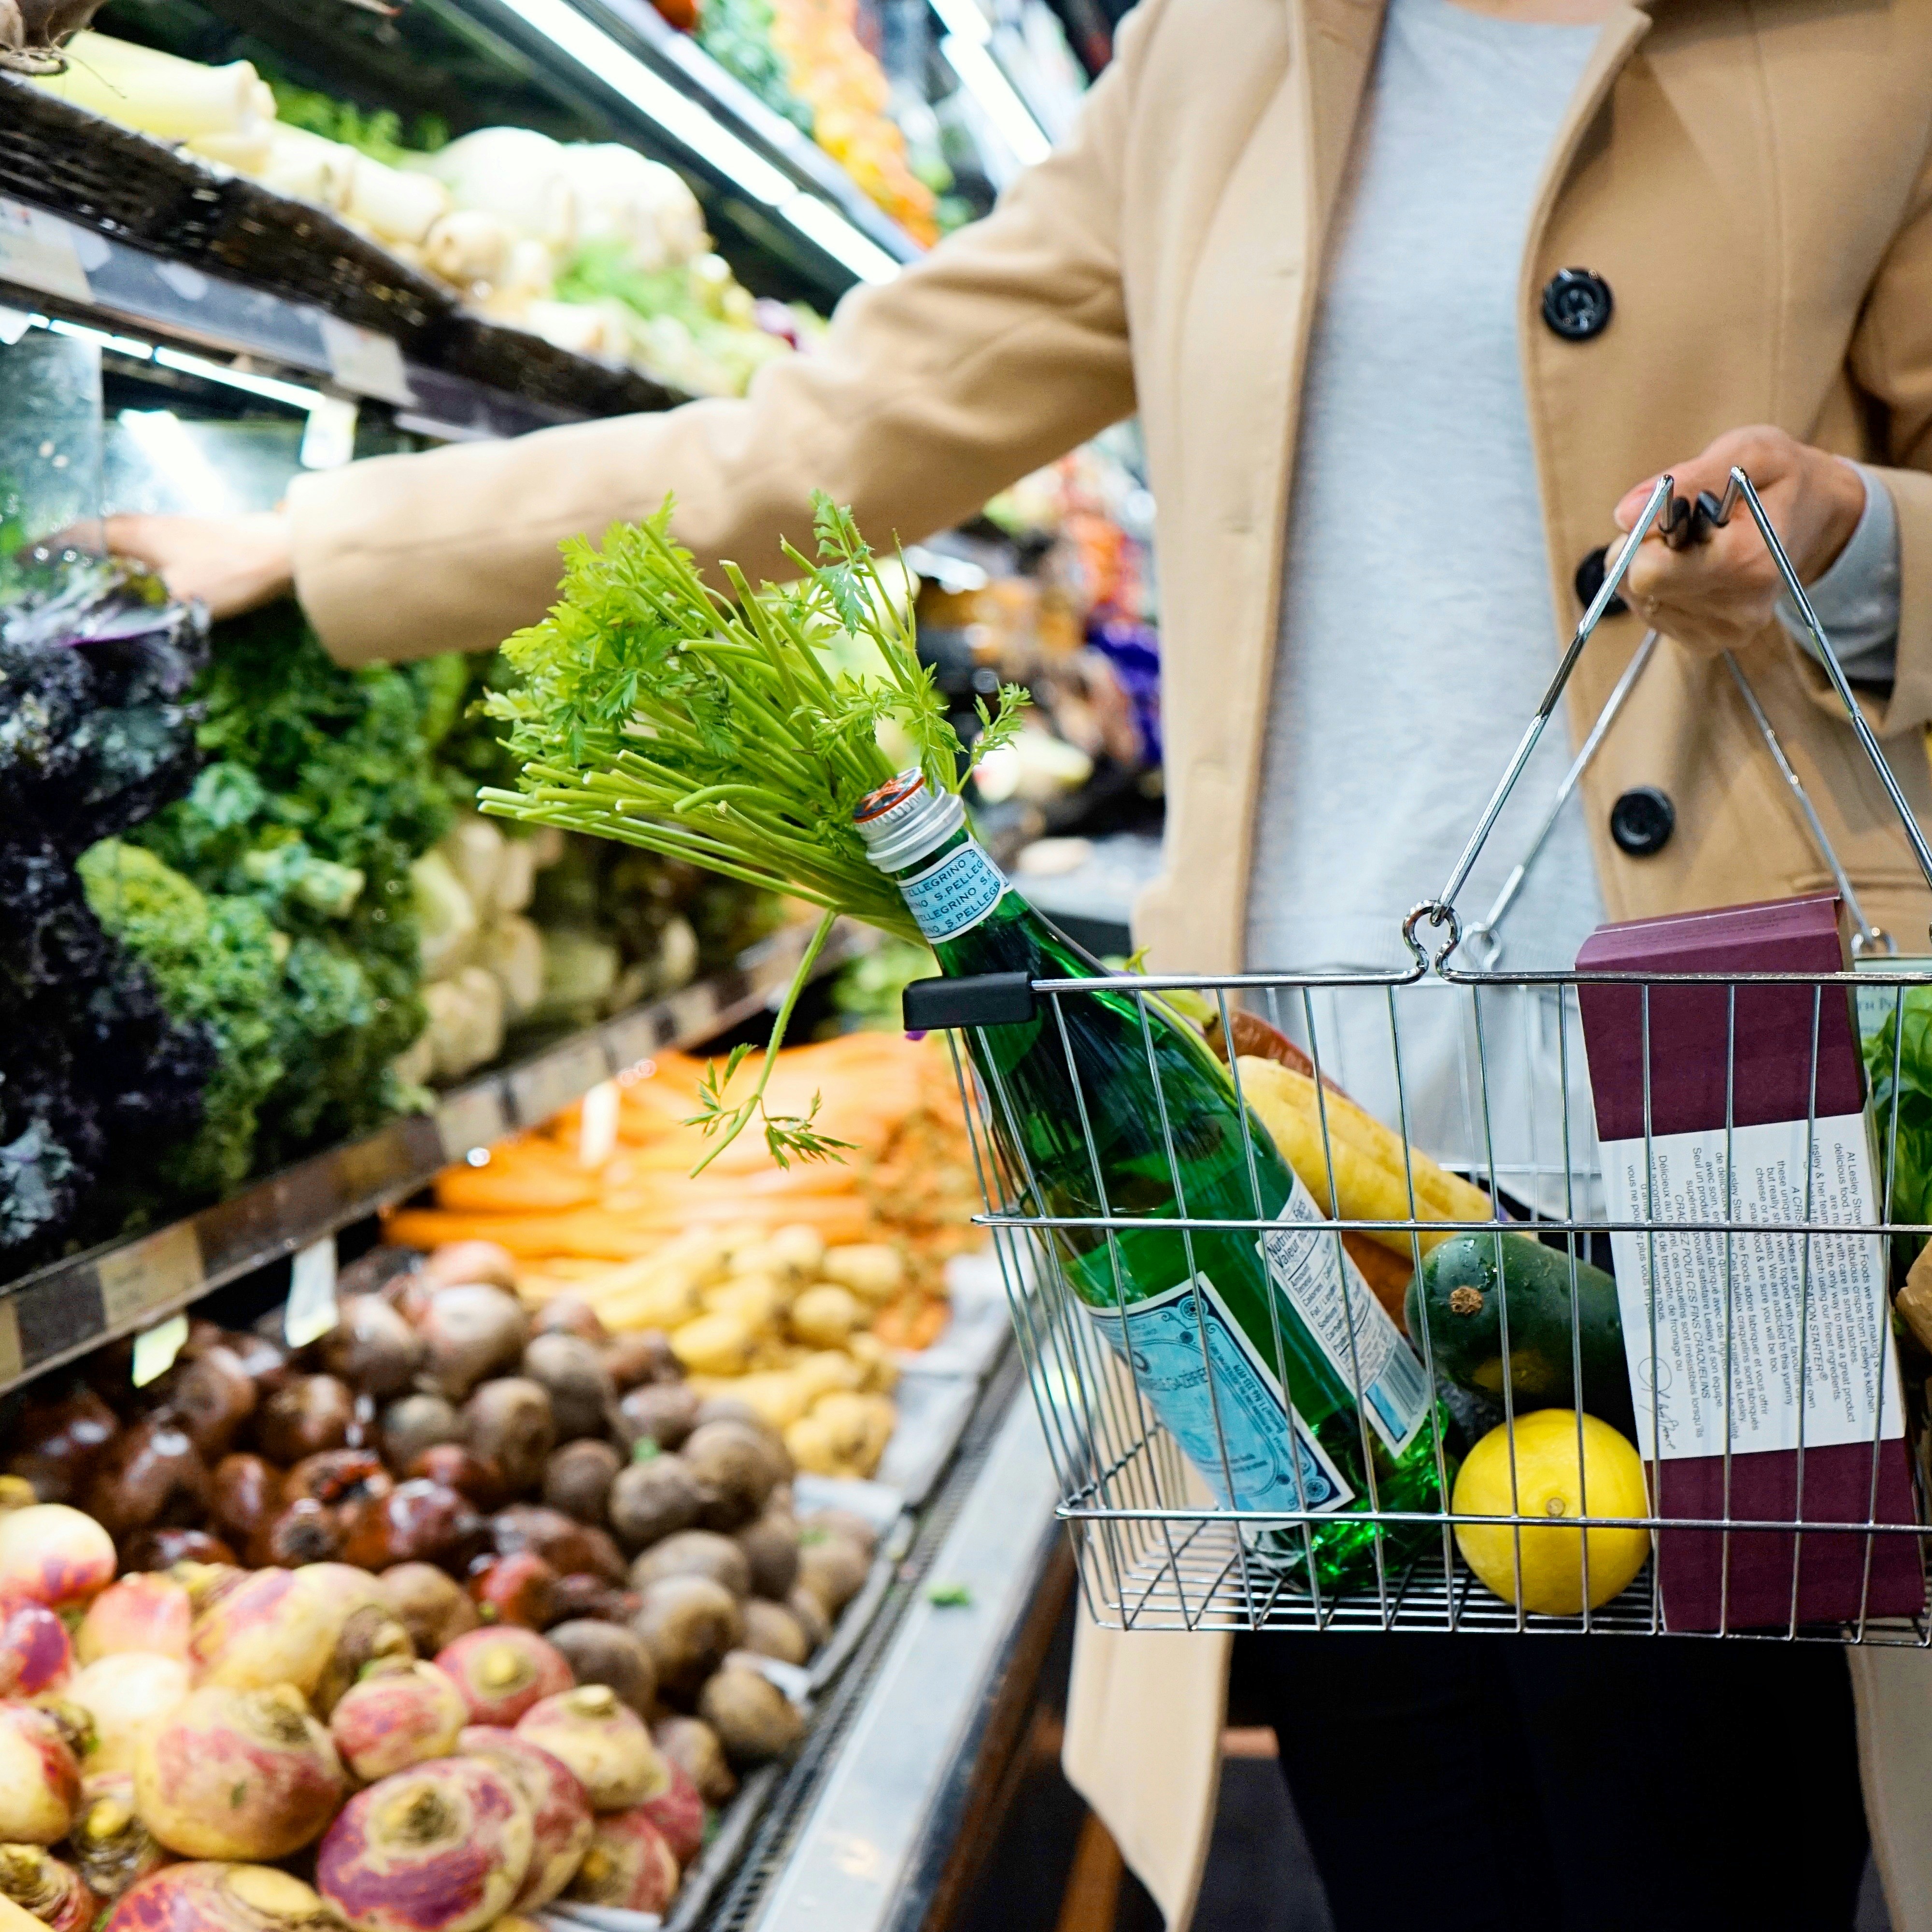
Cattle meat consumption
This indicator shows past development in cattle meat consumption relative to the EU target of a 34% decrease in cattle meat consumption compared to 2013 levels. The data show an annual decrease of 0.1 kg/capita between 2017 and 2022. To meet the target, the required annual reduction between 2023 and 2050 needs to be 0.1 kg/capita, which is 1.6 times faster than the current rate of progress.
Cattle meat consumption is defined as the total available supply of beef and veal meat (in retail weight and accounting for trade and inedible parts) per capita.
ENABLERS
Enablers are the supporting conditions and underlying changes needed to meet the objectives in a given building block. They are the opposite of barriers or inhibitors.
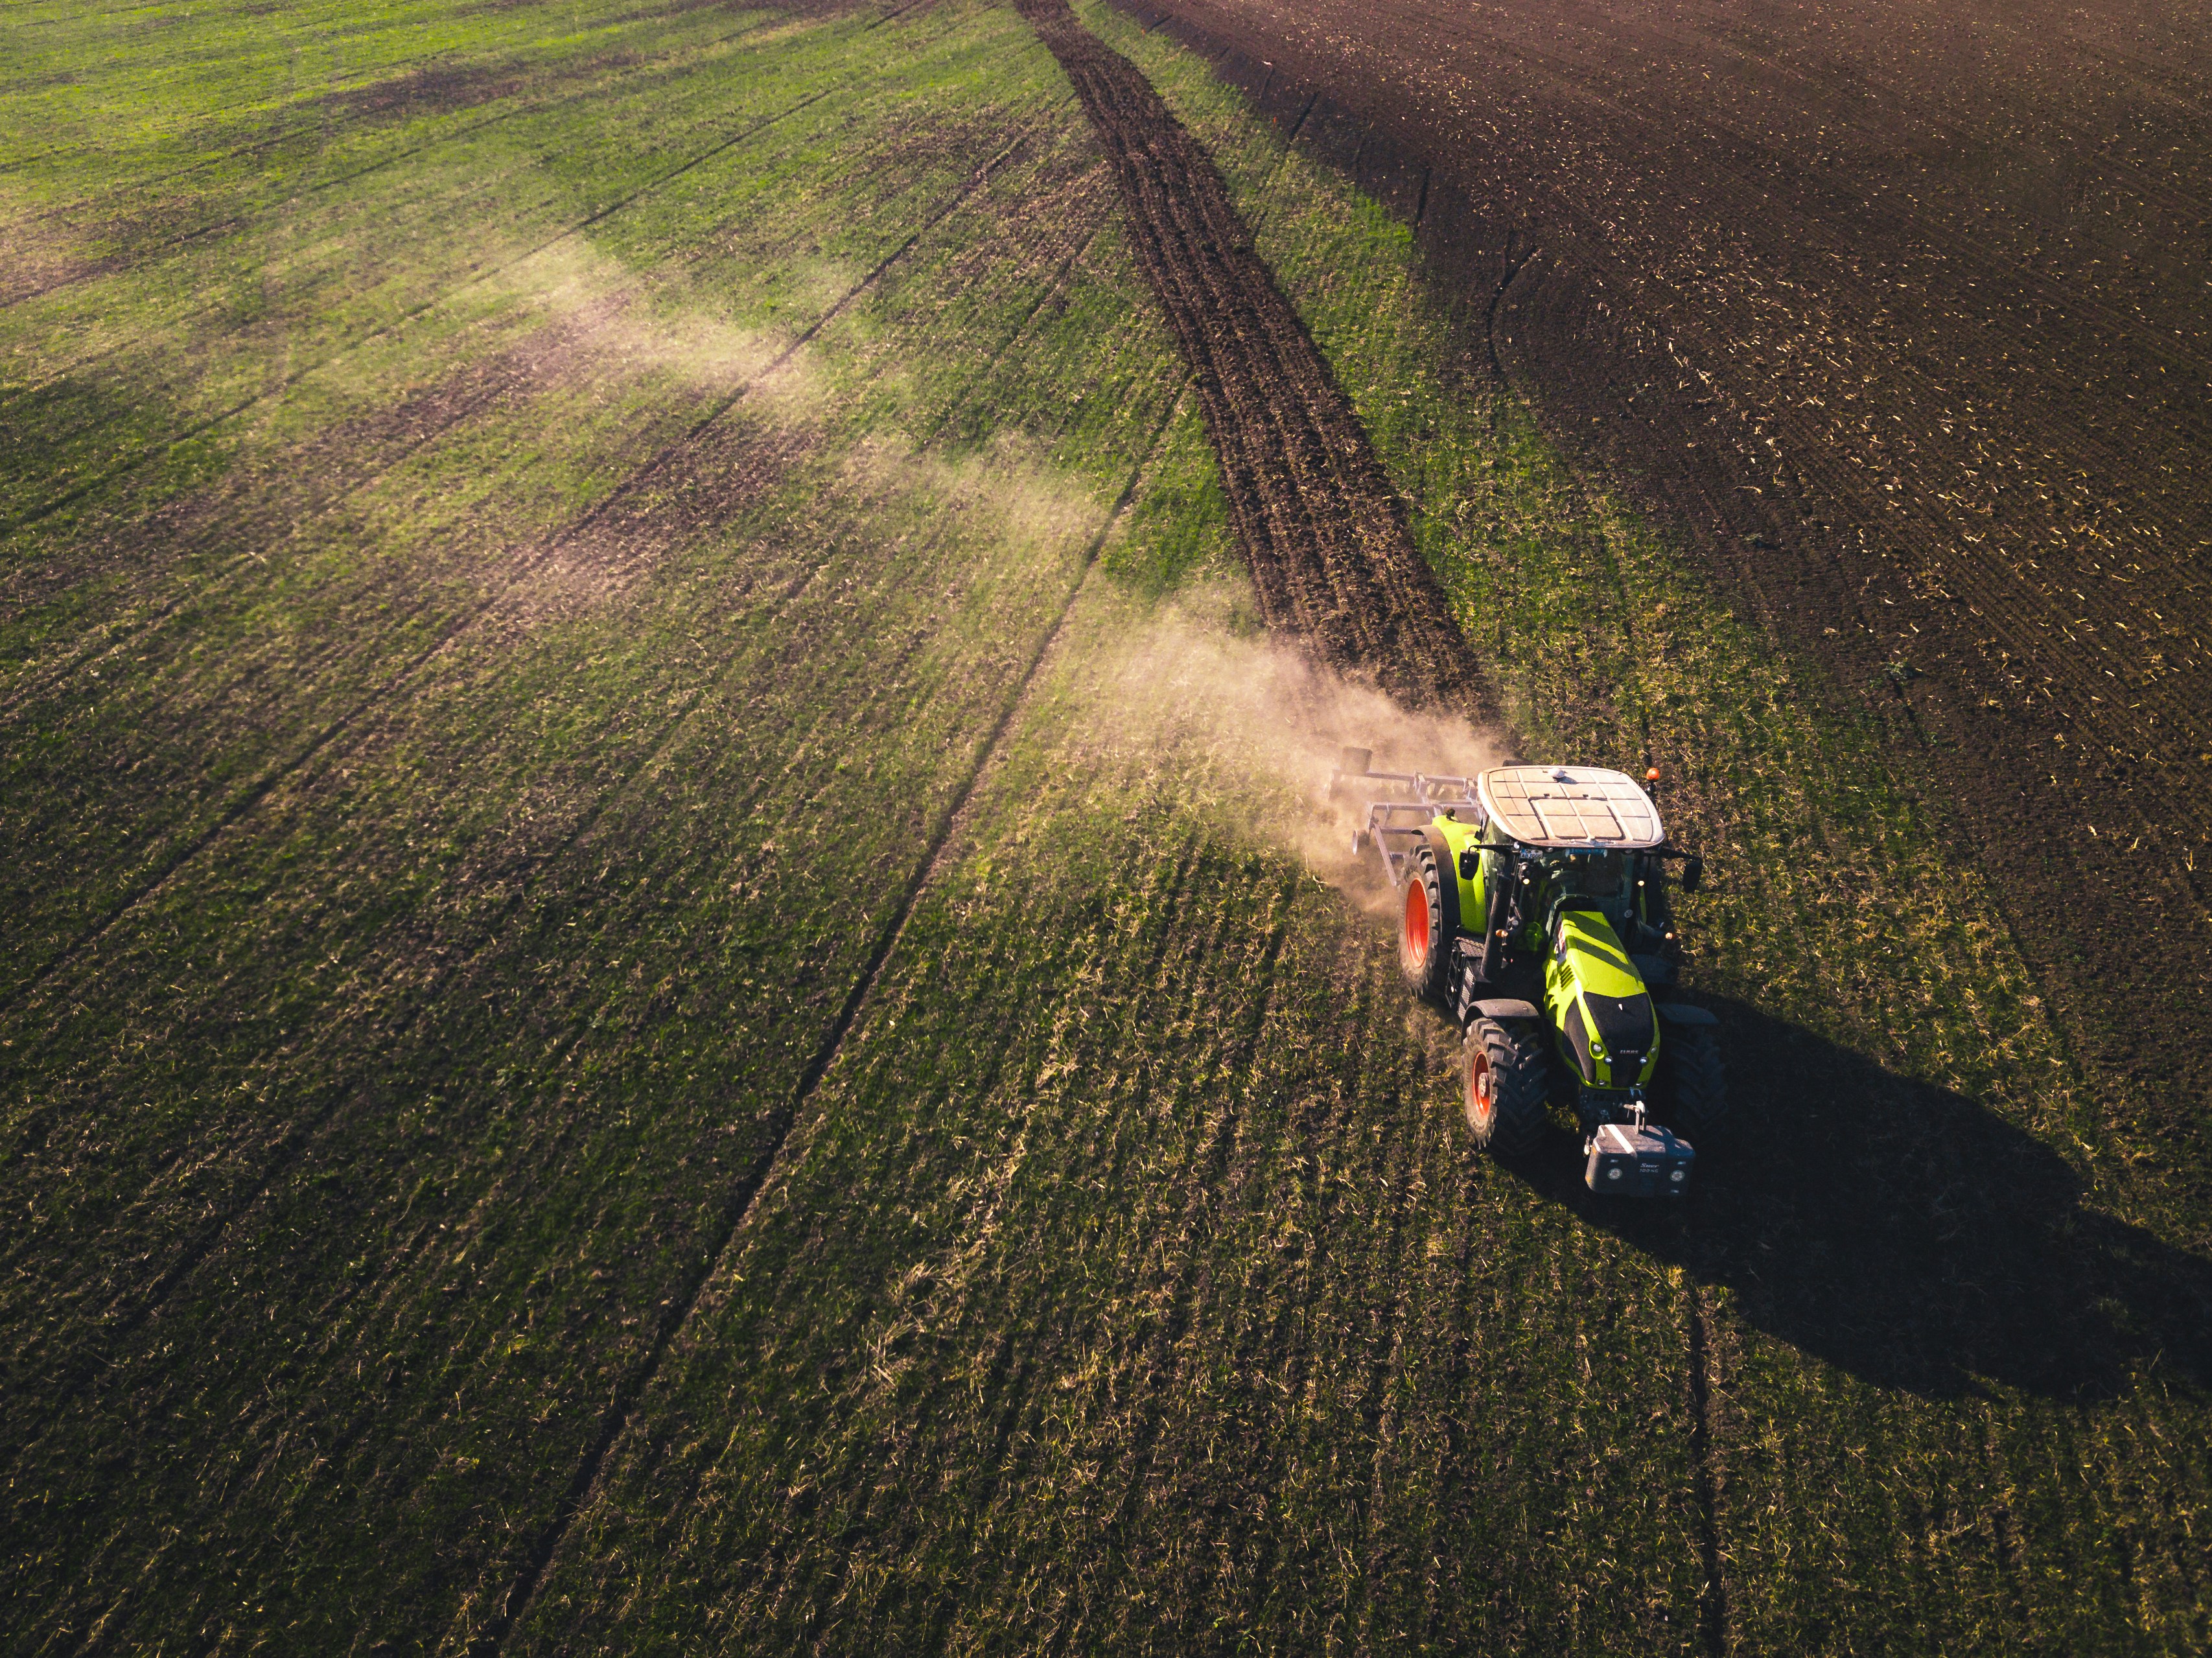
Enabler 1
Reducing fertiliser use and cropland-related emissions
Although the use of nitrogen fertiliser decreased since 2017 and is expected to decrease more rapidly over the next decade, the reduction rate was too slow to meet the reduction target of 20% by 2030 relative to 2018. The EU seeks to substantially increase the application of organic farming: by 2030, 25% of the EU’s total agricultural area should be farmed organically. However, the rate of progress towards this 2030 target was far too slow: at the current rate, organic farming will only account for roughly 15% of the EU’s entire agricultural area in 2030.
Nitrogen fertiliser use
This indicator shows past development in nitrogen fertiliser use per hectare of cropland in comparison to the EU target of a 20% reduction in nitrogen fertiliser consumption by 2030 (compared to a 2018 reference point). Data show an annual decrease of 0.8 kg N/ha between 2016 and 2021. To meet the target, the required annual change between 2021 and 2030 needs to be 1.5 kg N/ha, which is 1.8 times faster than the current rate of progress.
The use of nitrogen fertiliser for agricultural production divided by total hectares of EU cropland.
Share of organic farming in total agricultural area
This indicator shows past development in the uptake of organic farming in comparison to the EU target of reaching a 25% share of organic farming relative to total agricultural area in 2030. The data show an annual increase of 0.6 %-points between 2017 and 2022. To meet the target, the required annual change between 2021 and 2030 needs to be 1.8 %-points, which is 3.2 times faster than the current rate of progress.
Share of agricultural land either fully converted or in the process of converting to organic farming.
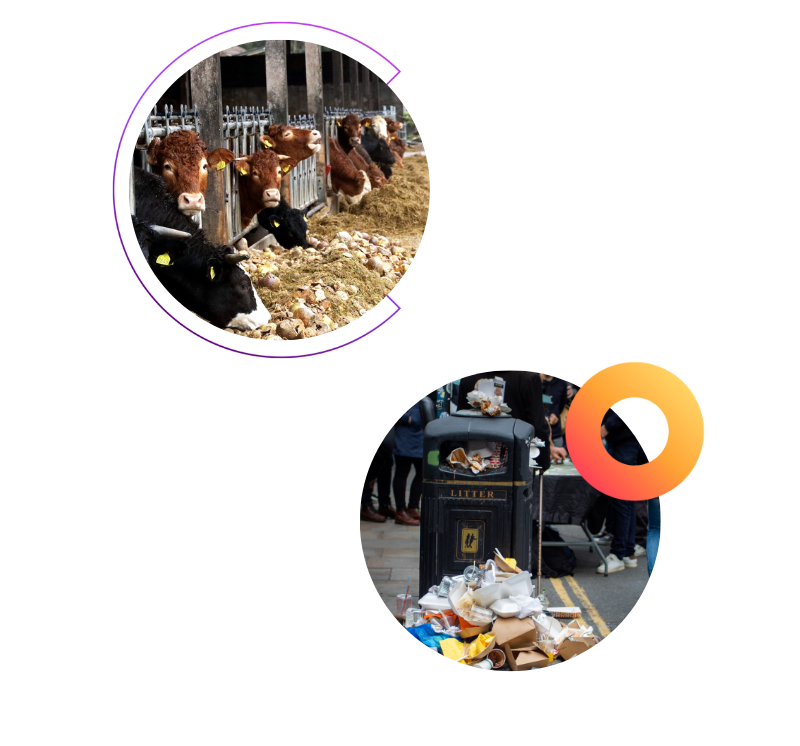
Enabler 2
Making livestock production more sustainable
The manure management emissions intensity of cattle, which are the largest source of manure management emissions, has remained nearly constant at 0.38 tCO2e per cattle for the past 20 years. Livestock numbers, driven by growth in poultry farming across the EU, steadily increased by 0.2% per year between 2016 and 2021.
Manure management emissions intensity of cattle
This indicator shows past development in manure management emissions per head of cattle. The data show an annual increase of 0.3% between 2016 and 2021. This development was heading in the wrong direction, and a U-turn is needed.
Average manure management emissions per head of cattle.
Livestock numbers
This indicator shows past development in total livestock numbers. The data show an annual increase of 0.2% between 2016 and 2021. This development was heading in the wrong direction, and a U-turn is needed.
Total livestock numbers in the EU, including cattle, swine, small ruminants, and poultry, among others.
Enabler 3
Reducing food waste and end-of-supply-chain emissions
The EU generated nearly 131 kg of food waste per capita in 2021. End-of-supply chain emissions include the emissions from food processing, transport, and packaging. Emissions from food processing, transport, and packaging have decreased since the early 2000s. Although headed in the right direction, reductions must be accelerated to remain aligned with the 2050 climate neutrality target.
Volume of food waste
This indicator shows past development in the volume of food waste. The data show that the volume of food past per capita increased to 131kg in 2021. This development was heading in the wrong direction, and a U-turn is needed.
Total food waste in kilograms per capita is the aggregate of food waste generated during primary food production, manufacture of food products and beverages, retail and other distribution, restaurant and food service, and total activities by households.
Emissions from food processing, transport, and packaging
This indicator shows past development in downstream emissions from food processing, transport, and packaging. The data show an annual decrease of 1,6% between 2016 and 2021. This development was heading in the right direction but should accelerate in the future.
Emissions associated with energy use from food processing and the production of packaging for food stuffs, and the domestic transportation of agricultural products.