Glossary
Glossary
Terminology

Building blocks are the economic sectors, such as energy, transport or industry, and cross-cutting areas, such as finance, innovation, and lifestyles, in which transformation is needed to achieve a climate neutral society by 2050, and across which ECNO tracks progress.
Building block assessment
Acceleration factor
Or the ‘required change in speed’ is the ratio of the required change versus the past change on a given indicator. This results in the example formulation: ‘We need to increase our annual emission reductions to at least 4.9 Mt CO2e per year – or 2.6 times faster than the 1.9 MtCO2e per year achieved in the past’.
Benchmarks
Future reference points against which progress for each indicator is compared. ECNO derives benchmarks from official EU sources, such as directives, regulations, strategies, and action plans, including their related impact assessments. Benchmarks often come in the form of quantified policy goals or targets.
Climate neutrality
Stands for the objective of achieving net zero greenhouse gas (GHG) emissions. This means that emissions are brought down as close to zero as possible, with remaining, difficult to abate emissions balanced by GHG removals within a given country or region.
Enablers
The supporting conditions and underlying changes needed to meet the objectives in a given building block. They are the opposite of barriers or inhibitors.
Historical data
Includes, but is not limited to, statistics from Member States harmonised and provided by Eurostat or the European Environment Agency (EEA) as well as from international organisations such as the OECD, FAO, or World Bank.
Indicators
Track the historical development and status of enablers and objectives based on quantitative data. An assessment of indicator progress compares the trend against the required development to meet a future reference point, where data and relevant benchmarks are available.
Objectives
Describe what needs to be achieved in each building block to reach climate neutrality.
Required change
The change that underlies a pathway that meets the identified benchmark or target. Where benchmarks are missing, the required change indicates a direction and speed of change.
Trend
The development of an indicator over time based on historical data. ECNO’s trendline is a straight, best-fit line that smooths out the variation in historical developments based on all data points, providing a sense of the general progress over time.

Lifestyles
Sustainable behaviour patterns and social practices, enabled by policies that make sustainable options accessible, affordable, and the default, are key for decarbonisation.

OVERVIEW:
Progress on lifestyles has been far too slow
There is some progress in habits and awareness, and a few promising policy proposals to establish the right choice architecture, but data are scarce, and the carbon and material footprints remain far off.
Progress towards sustainable lifestyles has picked up in speed compared to last year’s classification, but it is still far too slow. This is primarily due to positive developments in the diffusion of climate-friendly habits such as choosing plant-based options or taking self-reported action for the climate. However, limiting emissions from consumption still has a long way to go: The average carbon footprint of EU citizens declined far too slowly over the period assessed, and material consumption was even increasing. Scarce data availability, particularly regarding infrastructure development and economic incentives, and the lack of official targets make it challenging to assess the overall progress in this building block.
At present, the EU does not have an overall strategy targeting sustainable lifestyles. There are policy and implementation gaps in demand-side measures. However, there is movement in some Member States and local governments, and in some instances, lifestyle choices are tackled by other policy areas. The LIFE scenario of the impact assessment to the 2040 climate target shows how changes in lifestyles could reduce energy, land, and resource use. New and upcoming EU policy proposals support sustainable behaviour. The Circular Economy Action Plan lists measures to decrease resource use and provides data for monitoring progress. The EU Alternative Fuel Infrastructure Regulation (AFIR) and the revision of the trans-European transport network (TEN-T) would support the shift to more sustainable mobility choices.
A key necessity for advancing progress in lifestyles is the establishment of a comprehensive policy framework. The number of current policies targeting changes in behaviour is marginal. A first step is the Joint Research Centre’s Competence Centre on Behavioural Insights, which examines how values should be considered in policymaking. In addition, data availability in this building block is sparse and leaves little room for drawing conclusions on where progress might be insufficient. A low-hanging fruit is the consideration of data on EU funding for investments into enabling infrastructure in the regular assessments of EU funds. Finally, data on benchmarks is inexistent, underlining that lifestyle changes are still not a significant policy priority for the European Union.
INSIGHT TWO
The ability to properly monitor progress is hampered by limited data.

OBJECTIVES
Objectives describe what needs to be achieved in each building block to reach climate neutrality.
Objective
Limiting emissions and resource use
Through the end of 2022, average per capita material consumption in the EU increased after a slowdown caused by the pandemic and was thus moving in the wrong direction. The EU’s level of resource use surpasses the planet’s safe operating space. The carbon footprint from household expenditure decreased on average over the period, albeit this development was still far too slow and will need to accelerate significantly to be in line with climate neutrality by 2050.
Per person material footprint
This indicator shows past development in the per person material footprint. The data show an annual decrease of 0.1% between 2017 and 2022. Through 2019, the indicator’s development was moving in the wrong direction. More recent positive trends are likely significantly skewed by disruptions to consumption patterns during the pandemic.
Raw material consumption represents the amount of material required to produce the products consumed on average by each individual in the EU.
Per person carbon footprint from household expenditure
This indicator shows past development in the per person carbon footprint from household expenditure. The data show an annual decrease of 3.2% between 2015 and 2020. This development was heading in the right direction but should substantially accelerate in the future.
The carbon footprint is a measure of the GHG emissions that arise along the full production chain of all products or services purchased by the average EU household irrespective of where such emissions occur.
ENABLERS
Enabler 1
Providing enabling infrastructure
Infrastructure provisions should make sure that the most sustainable option is available for users, or at best the most convenient one to choose. At present, there are no data available that allow for a comprehensive assessment.
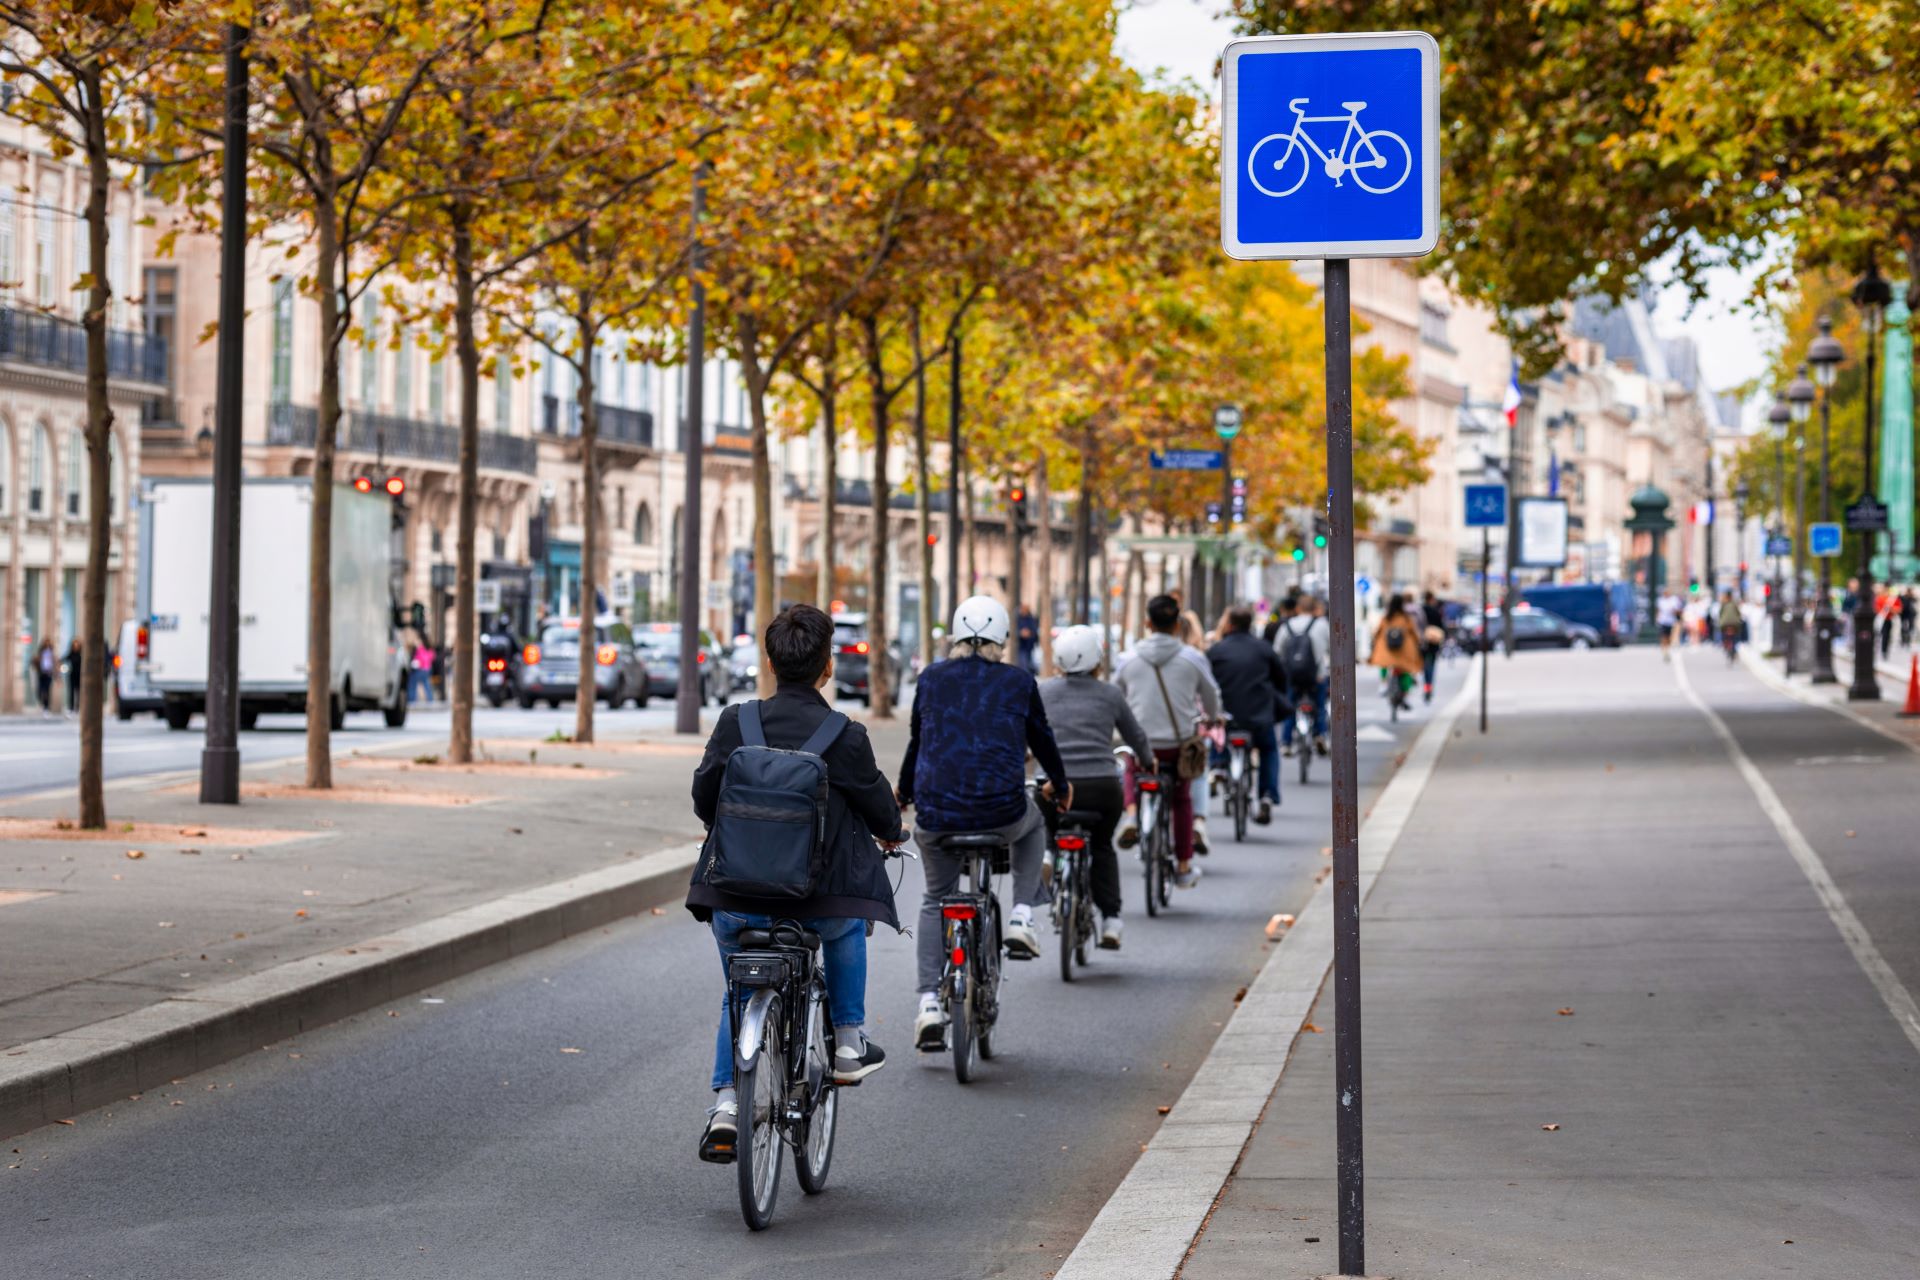
Investment in cycling infrastructure
At the time of assessment, there were no EU-wide aggregated data on investments in cycling infrastructure available. The planned investments in cycling infrastructure by EU Member States, coming from EU Structural Funds, showed an increase by 32% from the periods 2014 to 2020 and 2021 to 2027. While this shows a positive trend on the EU level, the efforts differ widely between Member States. Relying on only two data points, reflecting time periods instead of single years, the data do not allow a classification according to the ECNO methodology.
The indicator measures the financial resources allocated by the European Union or its Member States towards developing and maintaining cycling facilities. This includes spending on bike lanes, parking, signage, safety measures, and related amenities. The indicator assesses public investments aimed at promoting cycling as a sustainable mode of transportation.

Population living in municipalities that promote sustainable food in canteens
Sufficient data on the promotion of sustainable food in canteens by EU Member States or local governments are currently unavailable. Guidelines for sustainable public procurement, also in the food sector, exist but it is not clear how many cities chose to implement these. Interestingly, most cities that promote sustainable food in canteens focus on locally and/or organically produced food rather than on reducing the consumption of animal products.
This indicator outlines the share of the population that lives in areas where central, regional, or local authorities support the procurement of sustainable food in public and private canteens. There are currently no aggregated data available for the EU.

Enabler 2
Enhancing economic incentives
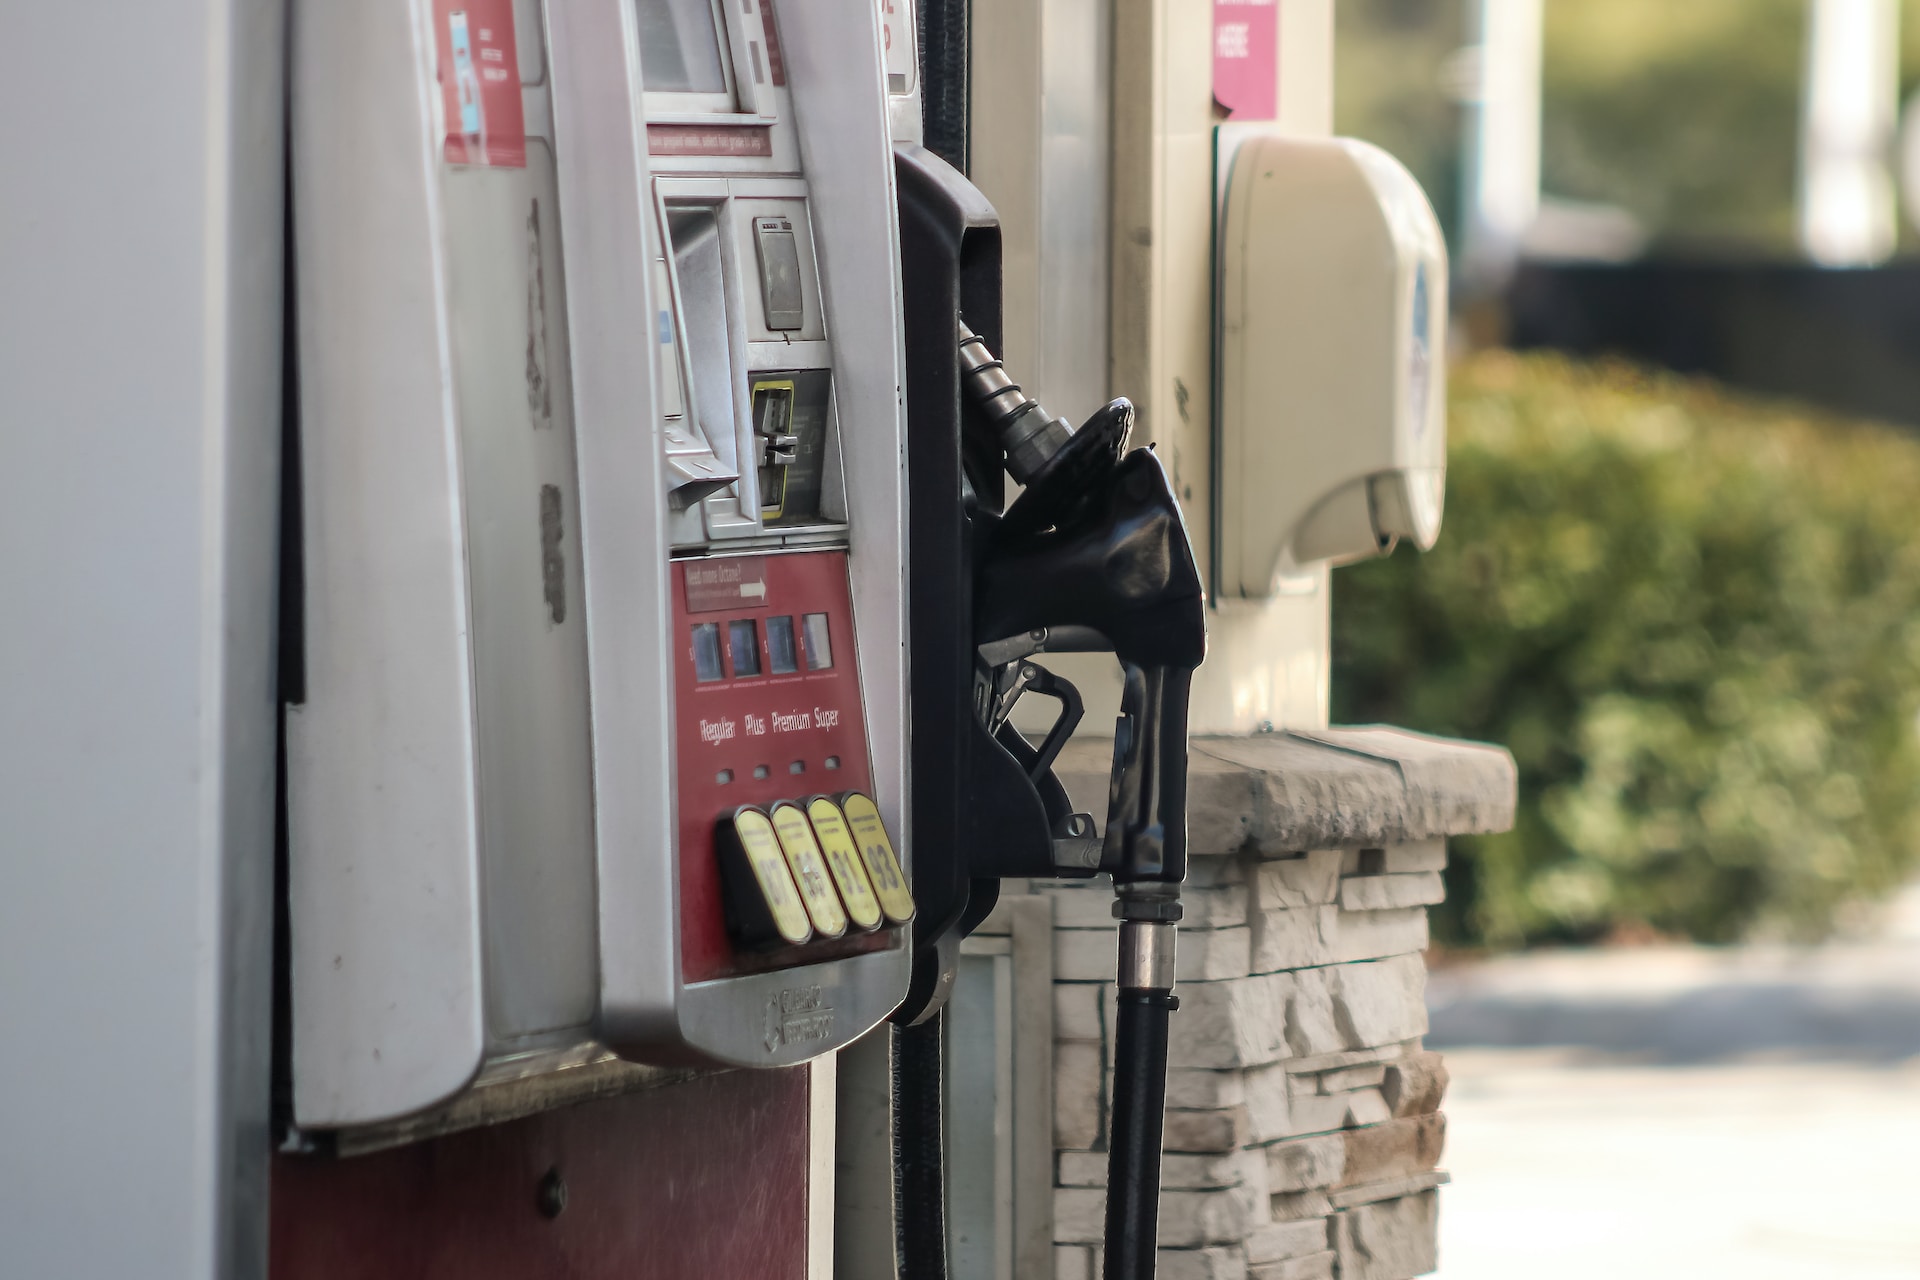
Implementing carbon pricing makes unsustainable products and services more expensive. The OECD monitoring of net effective carbon rates show an increase from 2018 (EUR 58.9 per t CO2e) to 2021 (EUR 74.7 per t CO2e). However, the carbon price might need to reach around EUR 190 by 2030 to align with climate neutrality. There are no EU-wide aggregated data on the affordability of vegetarian options compared to meat options.
Price on carbon
This indicator shows past development in the net effective carbon rates of 22 EU Member States plus the United Kingdom. There are insufficient data to calculate a trend for assessment. Still, existing data show an increase of 27% between 2018 and 2021. This increasing price signal for carbon-intensive products and services is a positive development for reaching climate neutrality.
Net effective carbon rates are a metric for how countries price carbon through fuel excise taxes, carbon taxes, and emissions trading systems. Using OECD data, the data set only includes EU countries that are part of the OECD and therefore functions as a proxy for an EU-wide measure.
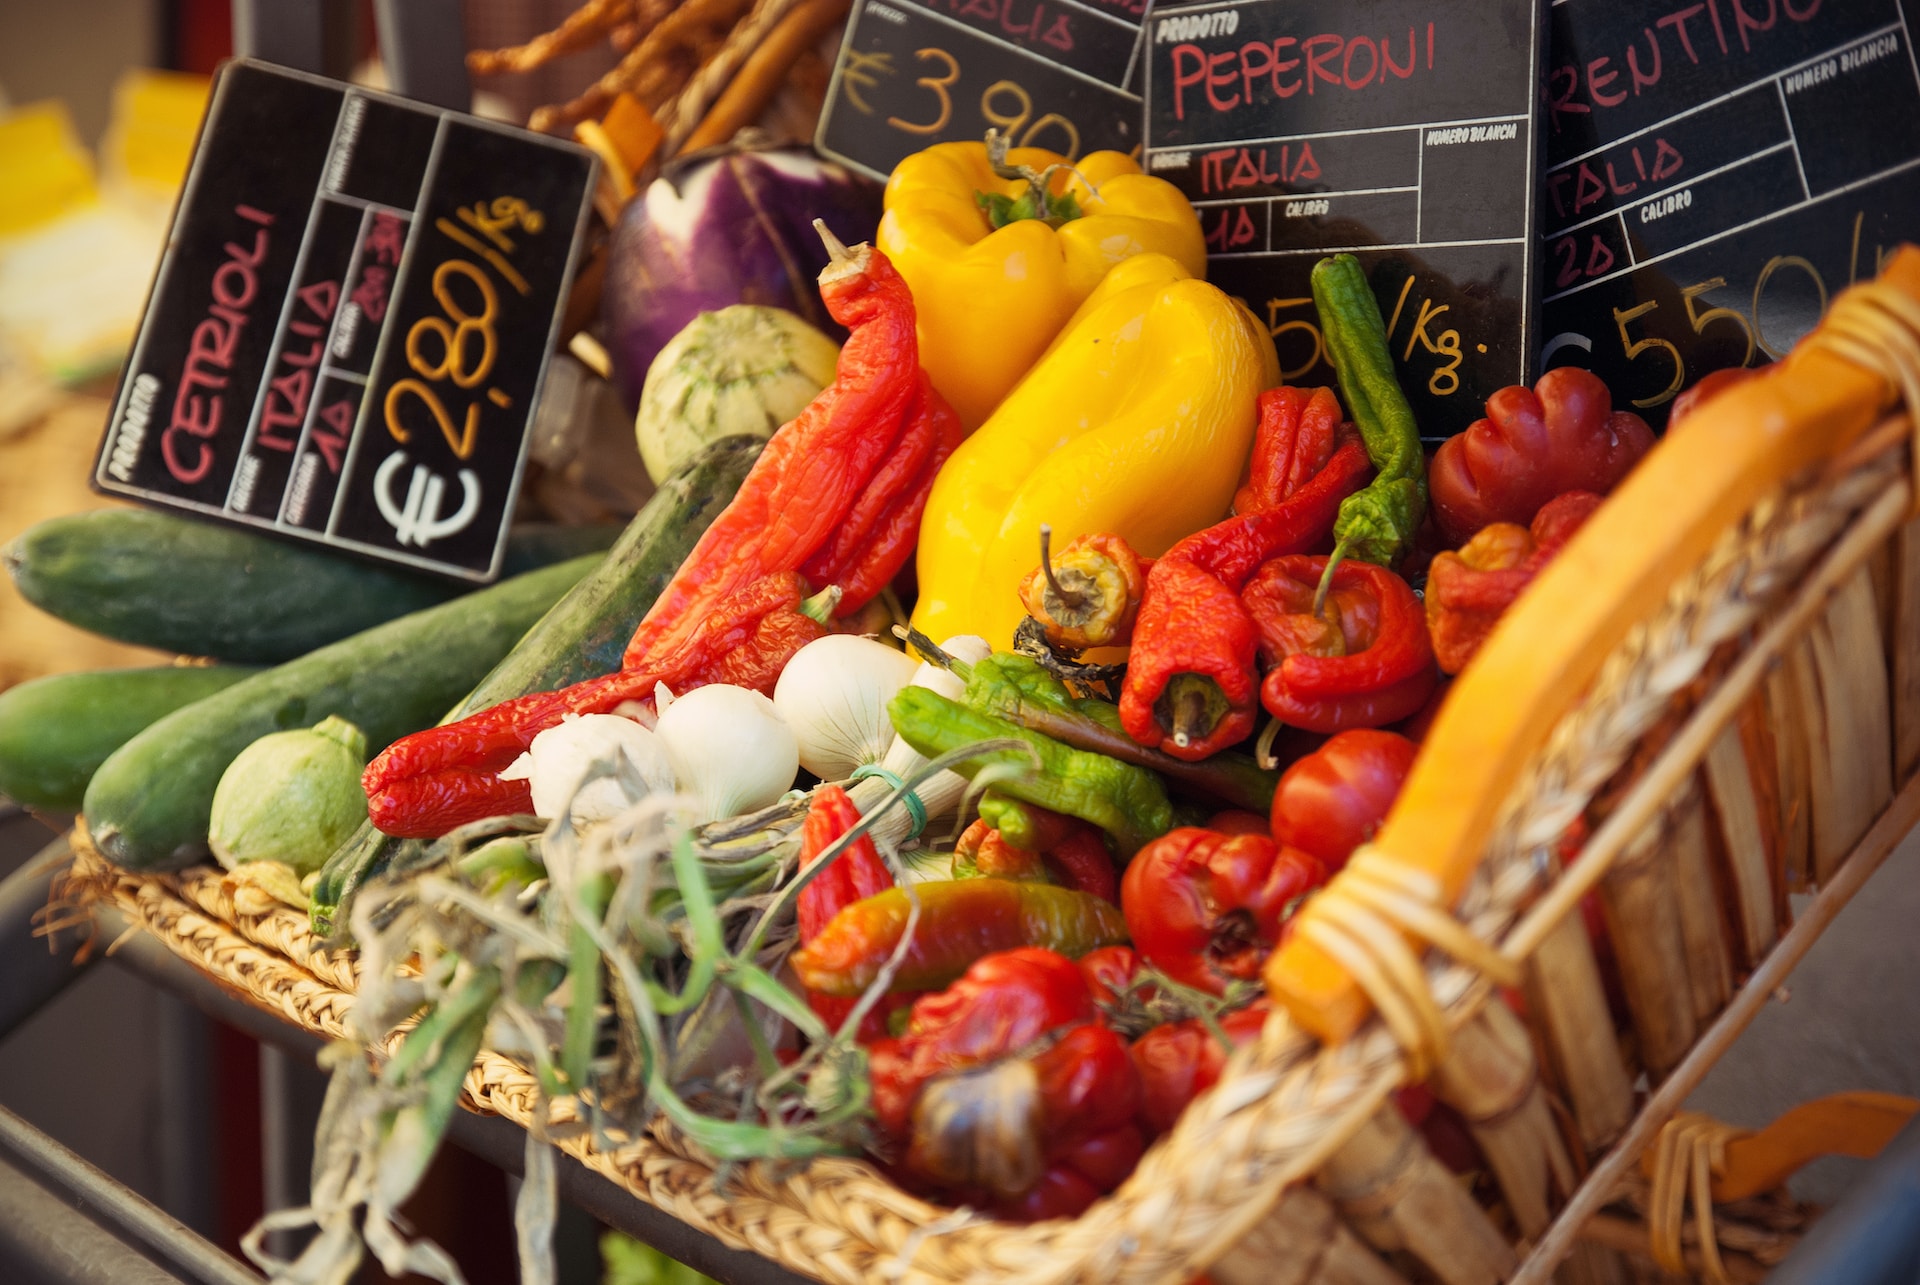
Affordability of vegetarian compared to meat options
Currently, there are no EU-wide aggregated data on the affordability of vegetarian compared to meat options. Recent studies comparing the costs animal- versus plant-based diets provide evidence to suggest that the latter is the cheaper choice, especially if the externalities of meat production are included in the calculation. These include the associated costs of climate change and the societal healthcare costs for diseases associated with a meat-rich diet. Notably, meat is more vulnerable to the impact of inflation on commodity costs, leading to higher prices for the end-consumer, while the prices for meat replacements remain stable.
The indicator tracks the relative cost of vegetarian diet versus one that include meat.
Enabler 3
Diffusion of climate neutral habits
Looking at the Eurobarometer’s biennial self-assessment, an increasing number of EU citizens have personally taken action to fight climate change in the last six months. This correlates with an increased awareness of the seriousness of climate change. The absolute sales of plant-based food show remarkable increases from 2020 to 2022, providing further evidence for a proliferation of climate-friendly norms.
Self-reported climate-conscious behaviour
This indicator shows past development in self-reported climate-conscious behaviour. An average annual increase of 1.2% between 2018 and 2023 suggests that individual sustainable behaviours are becoming increasingly widespread, despite the low threshold of the question. This development was heading in the right direction.
This indicator refers responses to the survey question, “Have you personally taken any action to fight climate change over the past six months?” included in the biennial Special Eurobarometer Climate Change survey series.
Climate-damaging advertisement
At present, there are no EU-wide aggregated data on the amount spent on climate-damaging advertisement. Still, at least in the agrifood sector, it seems that the EU is actually supporting increased emissions through advertising. For instance, EU grants to support promotion projects for European animal products have increased between 2016 to 2020, while similar grants for fruits and vegetables have decreased.
The indicator observes the amount spent (in EUR) on advertisement for carbon-intensive products and services, such as airlines, animal products or fossil energy.

Sales trends of plant-based food items in EU
The sales of plant-based food items grew by 11.8% per year from 2020 to 2022. These remarkable increases provide further evidence for a proliferation of climate-friendly norms. The trend has been driven by the increased availability and popularity of plant-based products among the population. There is no official EU target for the sales of plant-based or vegetarian food. However, the EU has set broader goals related to sustainable food systems and reducing the environmental impact of food production as part of its climate and sustainability strategies, e.g., in the Farm to Fork Strategy.
The indicator measures the annual retail sales value of plant-based food products in European Union countries. It tracks the financial performance of plant-based meat, seafood, eggs, and dairy alternatives, reflecting consumer demand and market growth. Data is sourced from retail sales reports, such as those provided by NielsenIQ, covering various EU countries.