Glossary
Glossary
Terminology

Building blocks are the economic sectors, such as energy, transport or industry, and cross-cutting areas, such as finance, innovation, and lifestyles, in which transformation is needed to achieve a climate neutral society by 2050, and across which ECNO tracks progress.
Building block assessment
Acceleration factor
Or the ‘required change in speed’ is the ratio of the required change versus the past change on a given indicator. This results in the example formulation: ‘We need to increase our annual emission reductions to at least 4.9 Mt CO2e per year – or 2.6 times faster than the 1.9 MtCO2e per year achieved in the past’.
Benchmarks
Future reference points against which progress for each indicator is compared. ECNO derives benchmarks from official EU sources, such as directives, regulations, strategies, and action plans, including their related impact assessments. Benchmarks often come in the form of quantified policy goals or targets.
Climate neutrality
Stands for the objective of achieving net zero greenhouse gas (GHG) emissions. This means that emissions are brought down as close to zero as possible, with remaining, difficult to abate emissions balanced by GHG removals within a given country or region.
Enablers
The supporting conditions and underlying changes needed to meet the objectives in a given building block. They are the opposite of barriers or inhibitors.
Historical data
Includes, but is not limited to, statistics from Member States harmonised and provided by Eurostat or the European Environment Agency (EEA) as well as from international organisations such as the OECD, FAO, or World Bank.
Indicators
Track the historical development and status of enablers and objectives based on quantitative data. An assessment of indicator progress compares the trend against the required development to meet a future reference point, where data and relevant benchmarks are available.
Objectives
Describe what needs to be achieved in each building block to reach climate neutrality.
Required change
The change that underlies a pathway that meets the identified benchmark or target. Where benchmarks are missing, the required change indicates a direction and speed of change.
Trend
The development of an indicator over time based on historical data. ECNO’s trendline is a straight, best-fit line that smooths out the variation in historical developments based on all data points, providing a sense of the general progress over time.


Carbon Dioxide Removal
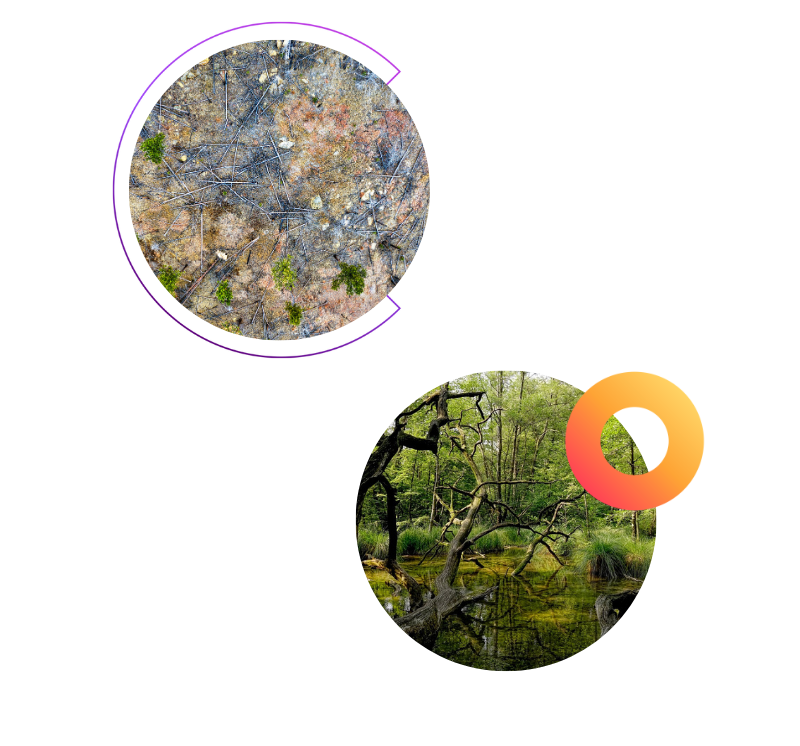
Carbon Dioxide Removal (CDR) is crucial to compensate for minimal residual emissions. It requires storing carbon in trees and soils and potentially using sustainable technical solutions in the future.
OVERVIEW:
Progress on Carbon Dioxide Removals was heading in the wrong direction
Natural sinks keep decreasing; technical sinks remain mostly in demonstration phase. There has been some policy progress in monitoring and certifying carbon removals, as well as ecosystem restoration.
The development of Carbon Dioxide Removal (CDR) was still heading in the wrong direction in the period assessed, which means no change to the progress classification of last year. Net removals by natural sinks were decreasing following a declining rate of carbon stored in trees and unreliable data for soils. No large-scale technical removal plants have been deployed in the EU yet. Technical removals are increasingly subject to political attention; however, these technologies are still not mature and are expensive and associated with substantial risks and trade-offs including high energy needs and pressure on land, water, and biodiversity.
The EU Climate Law requires that by 2050 total annual removals at least exceed total emissions. The EU’s Land Use, Land-Use Change and Forestry (LULUCF) Regulation sets binding EU and national net removal targets for natural CDR. If finalised, the Nature Restoration Law’s binding restoration targets for natural sinks should improve forest and soil carbon sequestration and improve adaptability to climate change. The Common Agricultural Policy (CAP) provides financial incentives to sustainably manage forests and soils. The proposed soil and forest monitoring laws aim to improve data availability and quality. The Union certification framework for permanent carbon removals, carbon farming and carbon storage in products, the Certification Framework for Carbon Removals (CFCR), aims at encouraging uptake of both natural and technical CDR. The EC’s Industrial Carbon Management Strategy seeks to incentivise technical CDR investments, outlining actions that should complement other existing policies.
For natural CDR, there is an urgent need to increase the quantity and health of forest coverage, as well as ecosystem restoration and sustainable management of forests and soils. Good data is a prerequisite for any certification or assessment of implemented subsidies, and to monitor natural CDR. To secure the deployment of sustainable technical CDR post-2030, progress should be made towards R&D funding and a greater focus should be placed on full lifecycle impacts. A legal framework must ensure sustainability compliance and long-term financing options. Technical removals should be deployed with coordinated infrastructure provision powered by renewable energy.
DEEP DIVE
Storing more carbon in trees
Despite recent signs of decreasing net LULUCF removals, forest area and carbon stock in forest land has grown between 2016 and 2021, mostly in France. Additionally, Italy and Bulgaria are driving positive change in forest area, and Poland and Germany show promising developments in terms of growing carbon stock in forest land. Overall, there still is a lack of a coordinated forest policy framework, harmonising forest regulations across regions and fostering carbon sequestration and ecosystem restoration.

INSIGHT ONE
We need more forests
Forests are crucial carbon sinks, but they are under severe pressure from droughts and increasing demand for wood. Near-natural forests can enhance resilience, support biodiversity, and allow for sustainable wood harvesting. Given the EU's limited role in regulating forest practices, it is essential to raise awareness of sustainable forest management and help countries to achieve their natural sink targets.

INSIGHT THREE
No deployment of technical removals
Technical removal options, such as Bioenergy with carbon capture and storage (BECCS) or Direct air carbon capture and storage (DACCS), have not been deployed at scale in the EU yet. These technologies are also yet to demonstrate sustainable application as they can put pressure on land, water, and biodiversity.
OBJECTIVES
Objectives describe what needs to be achieved in each building block to reach climate neutrality.
Objective
Enhancing natural sinks and delivering on technical removals
Even though net natural removals increased from 2021 to 2022, the 5-year trend line is still pointing in the wrong direction and signifies a declining sink. Removals must increase by 8.2 MtCO2e each year to reverse the trend and meet the 310 Mt CO2e net natural removal goal from the EU’s LULUCF Regulation. In addition, the EU Climate Law requires that by 2050 total annual removals at least exceed total emissions. No technical options in the EU removed CO2 from the atmosphere on a large scale in the period assessed, meaning that progress was far too slow to align with the EC’s objective for technical CDR of at least 5 Mt CO2e in 2030. The first Bioenergy with carbon capture and storage (BECCS) plants are under development in Sweden and Denmark.
Net removals from LULUCF (land-use, land-use change and forestry)
Net removals from LULUCF need a U-turn as data show an annual decrease of 3.4 Mt CO2e per year between 2017 and 2022. To achieve the LULUCF target of removing 310 Mt CO2e in 2030, the EU must achieve an annual increase of 8.3 Mt CO2e per year between 2022 and 2030.
Net removals from land use, land use change and forestry (LULUCF) equal the removal of CO2 from the atmosphere in the form of biomass on land and oceans. This includes emission fluxes from cropland, grassland, wetlands, settlements, and forests.
Net removals from technical solutions
Progress was far too slow as no technical CO2 removal facility was built in the EU between 2018 and 2023. The EC has the aspirational objective of removing 5 Mt CO2 in 2030 using technical removal options.
The indicator measures net removals from technical solutions such as Bioenergy with carbon capture and storage (BECCS) or Direct air carbon capture and storage (DACCS) with permanent storage of CO2.
ENABLERS
Enablers are the supporting conditions and underlying changes needed to meet the objectives in a given building block. They are the opposite of barriers or inhibitors.
Enabler 1
Storing more carbon in trees
Forests are the key land solution for removing CO2 from the atmosphere. Progress was still moving in the wrong direction in the assessed period. The carbon stock in forest land was increasing, but at a decreasing rate, with widely varying situations across Member States. The same applies to forest areas, which increased slightly but with a declining growth rate. This suggests a deteriorating ability of the EU’s forests to sequester carbon due to temperature effects, natural disturbances worsened by climate change, harvesting practices, and mismanagement. At the same time, current data may not reflect the changes in forest carbon sequestration due to a lack of harmonised monitoring across the EU.
Growth in forest area
Growth in forest area needs a U-turn as the area increased but at decreasing rate. The rate of forest area growth decreased by 7.200 ha or 3.7% per year between 2016 and 2021.
Forest area is the land spanning more than 0.5 ha with trees higher than 5 meters and a canopy cover of more than 10%, or trees able to reach these thresholds in situ. It does not include land that is predominantly under agricultural or urban land use. Data points are provided every five years which is the average over the preceding five years.
Growth of carbon stock in forest land
The carbon stock in forest land is increasing, but at a decreasing rate, from a 119 Mt C increase in 2016 to a 73 Mt C increase in 2021. The decreasing trend in carbon stock growth means that less additional CO2 is stored in each year leading to an overall reduction in natural forest removals.
Wood stocks are the volume over bark of all living trees with a minimum diameter of 10 cm at breast height (or above buttress if these are higher). It includes the stem from ground level up to a top diameter of 0 cm at the top of the tree, excluding branches. Data points are provided every five years which is the average over the preceding five years.
Enabler 2
Storing more carbon in soils
Healthy soils provide several ecosystem services, including food production, water purification, carbon storage, but also offer potential for additional carbon sequestration. However, soils are currently a net source of emissions as they are under significant pressures including land cover change, high-intensity land use, and erosion. The concentration of organic carbon in arable land, including both organic soils such as peatlands and the more prevalent mineral soils, decreased slightly. Linked to this, croplands, grasslands, and wetlands are still a net source of emissions. Although net emissions decreased by 1.4% per year between 2016 and 2021, these reductions are far too slow. It is important to note that data quality for soil carbon storage is poor due to measurement challenges.
Soil organic carbon in arable land
The concentration of organic carbon in arable land shows a minor decrease of 0.1% per year between 2009 and 2015, with no more recent data available. As the concentration of organic carbon needs to increase to meet removals targets, it needs to reverse its trend.
The indicator refers to the amount of organic carbon present in the topsoil of land that is used for agriculture.
Net CO2 emissions from crop-, grass-, and wetlands
The net CO2 emissions from wetlands, croplands and grasslands was heading in the right direction, but well below the required pace as data show an annual decrease of 0.8 Mt CO2 or 1.4% per year between 2016 and 2021.
Net CO2 emissions pertaining to carbon losses or gains from wetlands, croplands and grasslands.
Enabler 3
Applying technical removals sustainably
Data is limited for checking progress towards enabling technical removals. Yet, technical CDR is increasingly receiving political attention to achieve long-term targets and net-negative emissions thereafter. It is important to acknowledge the risks and trade-offs with its upscaling regarding high energy needs and pressure on land, water, and biodiversity. Technical CDR is not yet mature, with a few BECCS demonstration plants being built in Scandinavia, and costs are still high. Costs depend on the technology, related resource and energy needs and prices, and costs for transport and storage. They are likely to decrease quicker for DACCS than BECCS as the latter is subject to potential cost increases for land biomass. While BECCS and DACCS offer significant CO2 removal potential, other solutions are also being developed and deployed at small scales, such as biochar, with own risks and potentials.
Attention to technical CDR
Horizon Europe and the Innovation Fund both finance technical CDR projects as part of the CCS funding category. Regulating technical CDR is picking up speed on a Member State level with 23 Member States having formal CDR strategies in place and others, including Germany, additionally having a strategy for long-term negative emissions.
This indicator aims to track public and/or private sector attention to technical CDR in the EU.
Costs of BECCS and DACCS
Costs are still high: For DACCS, estimates range from USD 400-1,000, decreasing to USD 200-400 by 2050. The IPCC estimates costs of USD 15-400 for BECCS, with the higher end more likely. Costs depend on the technology, related resource and energy needs and prices, and costs for transport and storage. They are likely to decrease quicker for DACCS than BECCS as the latter is subject to potential cost increases for land biomass.
This indicator measures how far the development of these technologies has matured, and how this impacts the affordability of their deployment.